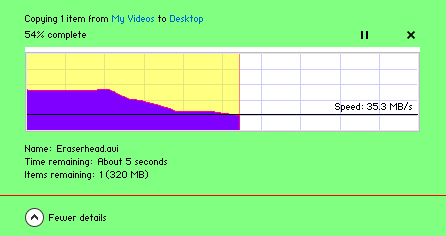
Graph:
Gray and White border: Progress > TransparentBar > Device Storage Background
Blue lines: Windows 8 (For Testing Purposes Only) > Windows 8 (For Testing Purposes Only) > Task Manager > Performance Charts > Copy > Grid
Pink edge: Windows 8 (For Testing Purposes Only) > Windows 8 (For Testing Purposes Only) > Task Manager > Performance Charts > Copy > Transfer Speed Border
Purple fill: Windows 8 (For Testing Purposes Only) > Windows 8 (For Testing Purposes Only) > Task Manager > Performance Charts > Copy > Transfer Speed Fill
Red line: Windows 8 (For Testing Purposes Only) > Windows 8 (For Testing Purposes Only) > Task Manager > Performance Charts > Copy > Transfer Speed Progress Border
Yellow fill: Windows 8 (For Testing Purposes Only) > Windows 8 (For Testing Purposes Only) > Task Manager > Performance Charts > Copy > Transfer Speed Top Fill
White background: Fonts, Colors, & System Metrics > Fonts & System Metrics > WINDOWCOLOR:COLOR
Black text and line: Fonts, Colors, & System Metrics > Fonts & System Metrics > WINDOWTEXT:COLOR
Panel:
Pale Green: Explorer & Shell > Shell > TaskDialog > PrimaryPanel
Red line: Explorer & Shell > Shell > TaskDialog > ControlPane
Black text: Fonts, Colors, & System Metrics > Fonts & System Metrics > WINDOWTEXT:COLOR
Blue text: Fonts, Colors, & System Metrics > Fonts & System Metrics > HOTTRACKING:COLOR
Pause button: Windows 8 (For Testing Purposes Only) > Pause > Button
Close button: Windows 8 (For Testing Purposes Only) > Copy Close > Button
(This is the same chart view for when you drag/drop move files and when you delete certain files too)
(Also you can change the opacity of the Performance Chart fillcolors by changing their ALPHALEVEL:INT values (0 is transparent to 255 which is opaque)
